Problem
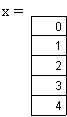
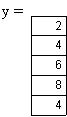
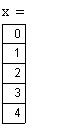
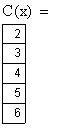
If we have the following set of data points
and these lines
-
Find the sum of squared errors for each line.
-
Which line gives the best fit for the data points, and why?
-
Using the Least Squares Fitting applet, find the best least squares line for the data.
Solution
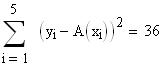
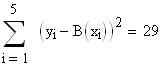
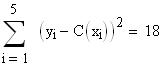
Computing the SSEs
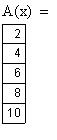
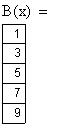
The sum of squared errors (SSE) is the sum of the squared differences between the y values of the data points and the y values of the line under consideration. If there are 5 points, these formulas computes the SSE for the points with each of the lines A, B, and C:
In detail, what we are doing is this. We calculate the y value of each line with the given x values of the data points.
Then the differences are computed, squared, and summed.
A
B
C
Which line is best?
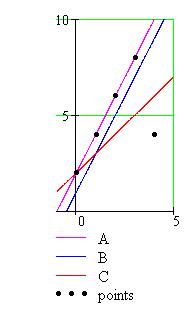
Before we pronounce which line fits the points best, we will get a rough idea of how well each line fits the data by graphing the data points and each of the three lines.
The graph shows us there are good and bad fits among the three candidate lines. For example, line A goes through the first four data points exactly, but makes a large error in estimating the fifth data point. Line B makes a smaller error in estimating the fifth data point, but as a result also makes small errors in estimating the first four data points. And line C starts off close to the first two data points, makes slightly larger errors with the next two, but comes closest to the fifth data point.
It is because it is difficult to choose a best-fit line based on these qualitative observations that we use the Method of Least Squares. Least Squares gives us quantitative information—that is, a number—and it is easy to compare this information for each line. Because the SSE is smallest for line C, we say that line C is the best least squares fit of the three candidates.
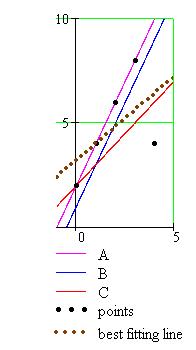
Finding the best least squares line
The overall best fitting line is not one of the three given in this problem. Beyond determining the SSE for a particular line that you are fitting against given points, the Method of Least Squares does something much more: it produces the line that fits the points best; that is, it tells you the line with the smallest sum of squared errors.
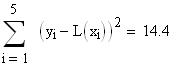
We use the applet to find this line. Enter the 5 points, then select 1 for the degree of the best least squares polynomial.
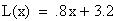
The best fitting line L(x) is show brown and dotted on the graph. Its SSE is
which is the smallest possible.