Problem
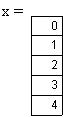
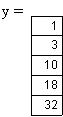
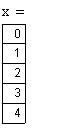
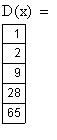
If we have the following set of data points
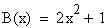
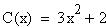
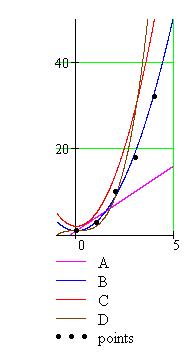
and these curves
-
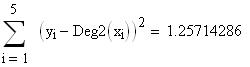
Find the sum of squared errors for each curve.
-
Which curve gives the best fit for the data points, and why?
-
Using the Least Squares Fitting applet, find the best least squares quadratic and cubic polynomials for the data.
Solution
Computing the SSEs
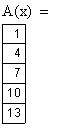
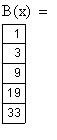
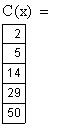
First, calculate the values each function takes at each of the given values of x.
Just looking at the values in the table, it seems as though A is increasing too slowly and D is increasing too quickly, as compared with the values for y, especially when x = 5.
To be more precise, we will use the SSE criterion for determining the best fit among these polynomials and calculate the sum of squared errors for each function.
A
B
C
D
Which curve is best?
Since the sum of squared errors is the least by far (3) for B, the criterion that we are using of minimizing the SSE states that the function B is the best fit (out of the given functions) for the data points.
To double-check our work, we can graph the given functions along with the data points to see if B is clearly a much better fit, as the Method of Least Squares suggests:
and indeed, B is the best fit.
Finding the best least squares curves
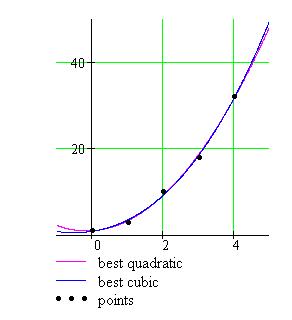
Using the applet, we enter the data points, and select 2 to find the equation of the best least squares quadratic curve, then select 3 to find the equation of the best least squares cubic polynomial.
Both of these result in very small SSEs, and fit the points very closely, as we can see on the graph.