Problem
A succession of forest fires has been decimating the countryside. The following table of data is available:
Days elapsed
Acres destroyed
5
10
15
20
25
150
1100
3600
8400
16000
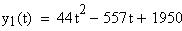
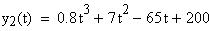
The following two functions have been suggested to model the data. Which one is a better fit?
Solution
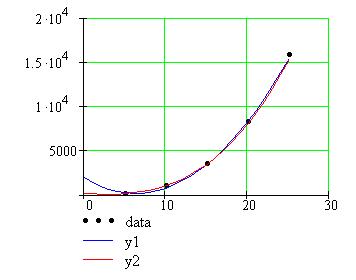
Both curves appear to fit reasonably well, so we don't get much help from the graph.
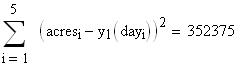
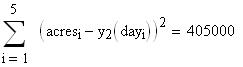
We use the sum of squared errors criterion, and calculate the sum of squared errors.
By the SSE criterion, we choose y1 as the best fitting curve, because its sum of squared errors is smaller.