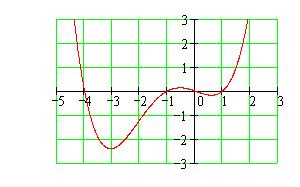
Problem
Draw the derivative of the following graph.
Solution
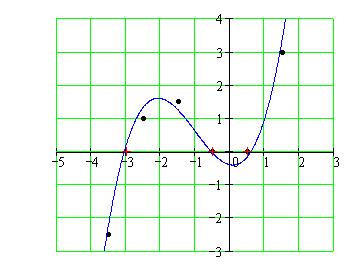
To approximate the graph of the derivative, we will look at the approximate slope of the graph over each interval between the integers. We will use secant lines, or average rates of change, to approximate these slopes. Then we plot those values on a new graph and connect the points to form a smooth curve.
We note also some features of the original graph: it is decreasing until about x = –3, then increasing to about x = –.5, decreasing again to about x = .5, then increasing thereafter. So, we expect to see the graph of the derivative negative until x = –3, positive between –3 and –.5, negative between –.5 and .5, and positive from .5 onward.
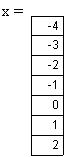
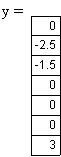
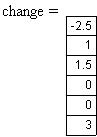
The tables below show the approximate y value for each integer x value, and the average rate of change over each of the intervals. We also include the places where the derivative is 0, as described above. These are marked as red + signs on the graph.