Problem
We have a 100-gallon tank filled with water. Saltwater is being pumped into the tank through two pipes. One pipe adds water at a rate of 3 gallons per minute, and the salt concentration is 12 grams per gallon. The other pipe adds water at a rate of 2 gallons per minute, with salt concentration of 7 grams per gallon. Water drains out of the tank through a hole in the bottom at the rate of 5 gallons per minute, so the total amount of water in the tank is kept constant at 100 gallons.
Assume that the tank is kept well-mixed, so that at any point in the tank, the concentration of salt is the same as at any other point. If the amount of salt initially in the tank is 20 grams,
-
Write an equation which states how the amount of salt S is changing with respect to time.
-
Use the differential equation from part 1 to write a function that states how much salt is present in the tank at a given time t.
Solution
1. Finding the differential equation
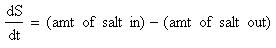
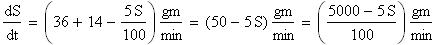
The rate of change of the amount of salt depends on how quickly salt is entering the tank through the pipes, and how quickly it is leaving through the hole. Thus, the equation has the form
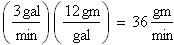
The amount of salt entering through the first pipe (per minute) is
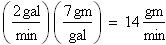
and through the second pipe
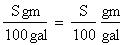
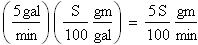
The amount of salt leaving through the hole is trickier to compute, since it depends on the concentration of the salt in the water. Since the tank is well-mixed, if there are S grams of salt in the 100-gallon tank, the concentration is
and so the amount of salt leaving per minute is
Therefore
2. Solving the differential equation
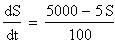
To find the function that states how much salt is present in the tank at a given time t, we now solve the differential equation
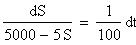
by separation of variables:
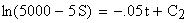
Integrating both sides, we get
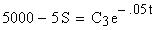
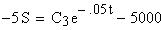
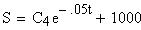
where C is an arbitrary constant. Simplify and solve for S:
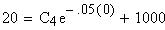
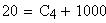
Next, solve for the constant C4 by using the initial condition t = 0, S = 20:
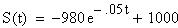
Therefore, the equation giving the amount of salt in the tank at time t is
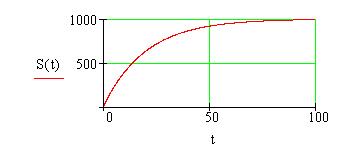
We can examine the change in the concentration of saltwater in the tank by graphing the function to see how it behaves.