Problem
A certain river has the following rainfall discharge data after a storm:
Time (hrs)
Rainfall discharge (m3/sec)
0
5
10
15
20
250
508
966
473
250
The storm produces the following rainfall:
Time (hrs)
Rainfall (inches)
Find the base flow of the river, the total volume of rainfall discharge, and the lag time between the rainfall event and the rainfall discharge.
Solution
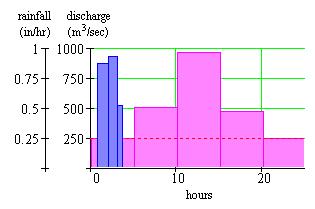
Here's a hydrograph made from the rainfall and discharge data.
The base flow of the river is the discharge in the absence of a rainfall event�in other words, the minimum of the raw discharge data. Here, this is 250 m3/sec.
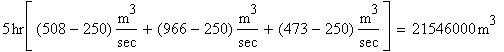
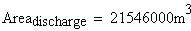
The rainfall discharge is the discharge (in m3) of the river over and above the base flow line (above the dotted line in the hydrograph). This is the area of the 3 red rectangles on the hydrograph, each of width 5 hours. So the rainfall discharge equals
This occurs over the period of 15 hours when the flow is measured.
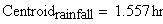
The lag time between the rainfall event and the rainfall discharge is defined as the difference between the x values of the centroids of the discharge and the rainfall data. We will find the x coordinates of both centroids.
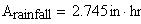
The rainfall plot is made up of 3 rectangles, so the x coordinate of its centroid is the sum of the midpoint coordinates of each rectangle times the area of the rectangle, all divided by the area of the rainfall plot.
The area is easy to calculate: it is the sum of the areas of the three rectangles.
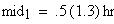
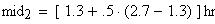
The midpoints of the 3 rectangles are
The x coordinate of the centroid is therefore
The discharge data is made up of 5 rectangles, but we're only concerned with the rainfall discharge, which corresponds to the graph above the base flow line. These are the same 3 rectangles we examined when calculating rainfall discharge, so they have area
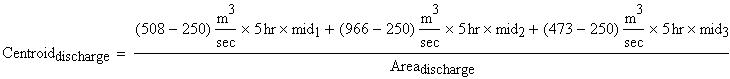
We calculate the x coordinate of the centroid of the rainfall discharge the same way as above.
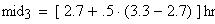
The midpoints of the 3 rectangles are
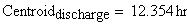
The x coordinate of the centroid is
The lag time is