Problem
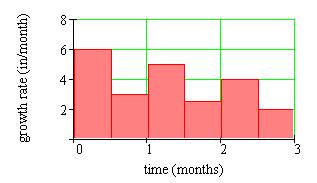
A flower grows at varying rates, measured at the beginning of each month and halfway through each month, according to the following chart.
What is the approximate height of the flower after three months?
Consider a second flower that requires fertilizer to grow, and compute the lag time between the application of fertilizer and the flower's growth.
Solution
If we assume a constant growth rate during each half-month period, we can approximate the flower's height by finding the area of each rectangle on the graph and adding the areas together.
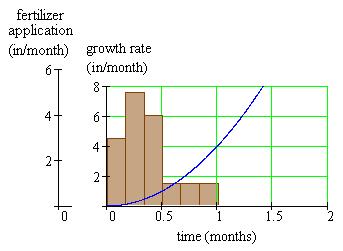
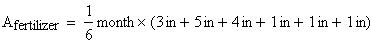
Now, consider another flower which won't grow without fertilizer. Certain amounts of fertilizer are put in its pot over the first month of growth, given by the table below.
Time (months)
Fertilizer
application
(inches)
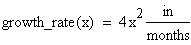
Suppose the growth rate of the flower over its first two months of growth is given by
where x is measured in months.
What is the lag time between the application of fertilizer and the flower's growth?
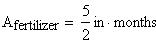
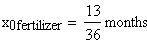
To find the lag time, we need to find the centroids of the fertilizer and growth plots, then calculate the difference between their x coordinates.
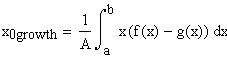
First, the centroid of the growth plot. Using the formula from section 4.11 in the textbook, we have
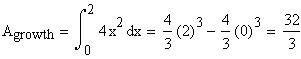
Here, f(x) = 4x2, g(x) = 0, a = 0, and b = 2.
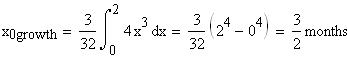
Therefore
Next, we find the x coordinate of the centroid of the fertilizer plots. This is calculated the same way as in example 1.
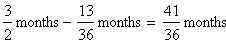
So the lag time between application of fertilizer and growth is