Planning Household Budgets-12
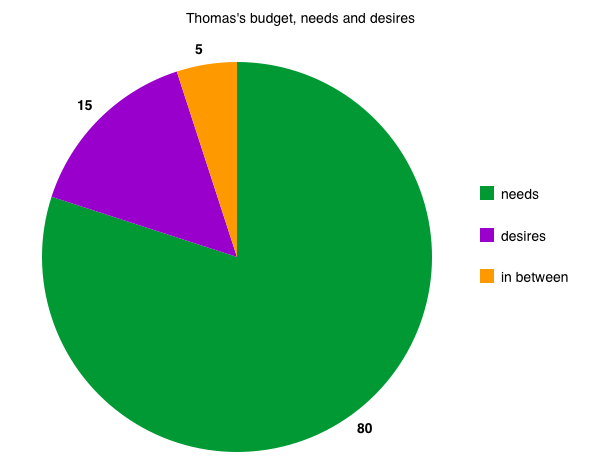
What proportion of Thomas's expenses are necessities? You can express this as a pie chart like this one using Create a Graph :
(Here are some notes to the instructor [PHBNI-12]).
What proportion of Thomas's expenses are necessities? You can express this as a pie chart like this one using Create a Graph :
(Here are some notes to the instructor [PHBNI-12]).