Section 1.8 The seige of Syracuse
Worksheet
Objectives
- Build a model from data
- Apply integration techniques to solve an idealized differential equations model
- Interpret integration constants as conditions on the differential equations model
- Explain the deviation of the data from the theoretical results
Over 213-212 B.C.E., the Roman Republic laid siege to the city of Syracuse and eventually conquered it. The siege was long and drawn out mainly due to the efforts of one of antiquity's greatest mathematicians, Archimedes, who created new and imaginative weapons of war to repel the attackers.
Figure 1.8.1 shows parabolic mirrors that Archimedes designed that Syracuse used to focus sunlight onto the sails of the attacking ships, setting them on fire. He also created a claw-like weapon that could be used to grab onto and sink ships as they got close to the city walls. And, he created improvements to catapults that allowed the Syracuse army to more easily target and sink ships farther out at sea.

Archimedes was so successful, that the city held off the Romans for many months. When the walls were finally breached, the Roman commander ordered that Archimedes be captured alive. A soldier found him deep in concentration over a problem in mathematics. Perhaps not recognizing him, he ordered him to stand up. Archimedes, as the story goes, was so displeased by the interruption, he angrily derided the soldier who, in his own anger, killed him.
We will focus on one part of this story - how do we best aim a catapult to hit a specific target? We'll approach this first experimentally by collecting data and using it to model the relationship between the angle of the catapult launch and how far the projectile goes. Second, we'll approach this theoretically by using integration to help solve a differential equation that models projectile motion.
1.
In your groups, use the model catapults to fire a projectile and measure where it lands - watch this video to see a demonstration of how to use the model. Collect data for at least 10 different firing angles and record them in [googlesheet].2.
Use the colab notebook to plot your data and try different choices of curves to fit. With your group, discuss the various possible fits and decide which of them you think is the best model.3.
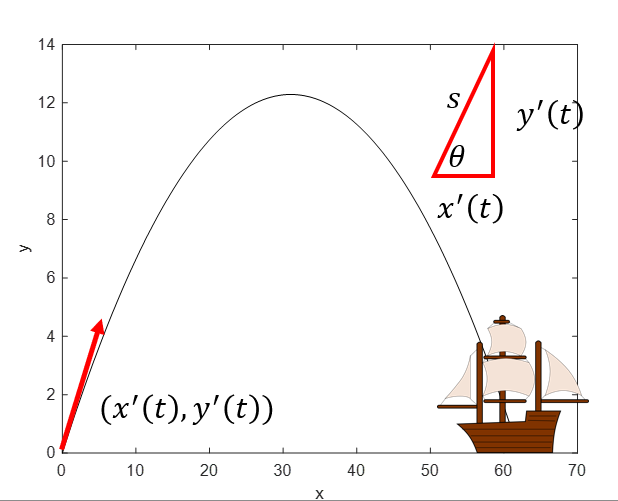
[Watch video on projectile motion] Thinking about the model derived in the video on projectile motion, what are reasonable choices for \((x_0,y_0)\) and \((x'(t),y'(t))\) for your experiments with the catapult?
Use our techniques for anti-differentiation to find functions that represent the vertical and horizontal position of the projectile over time according to this model.